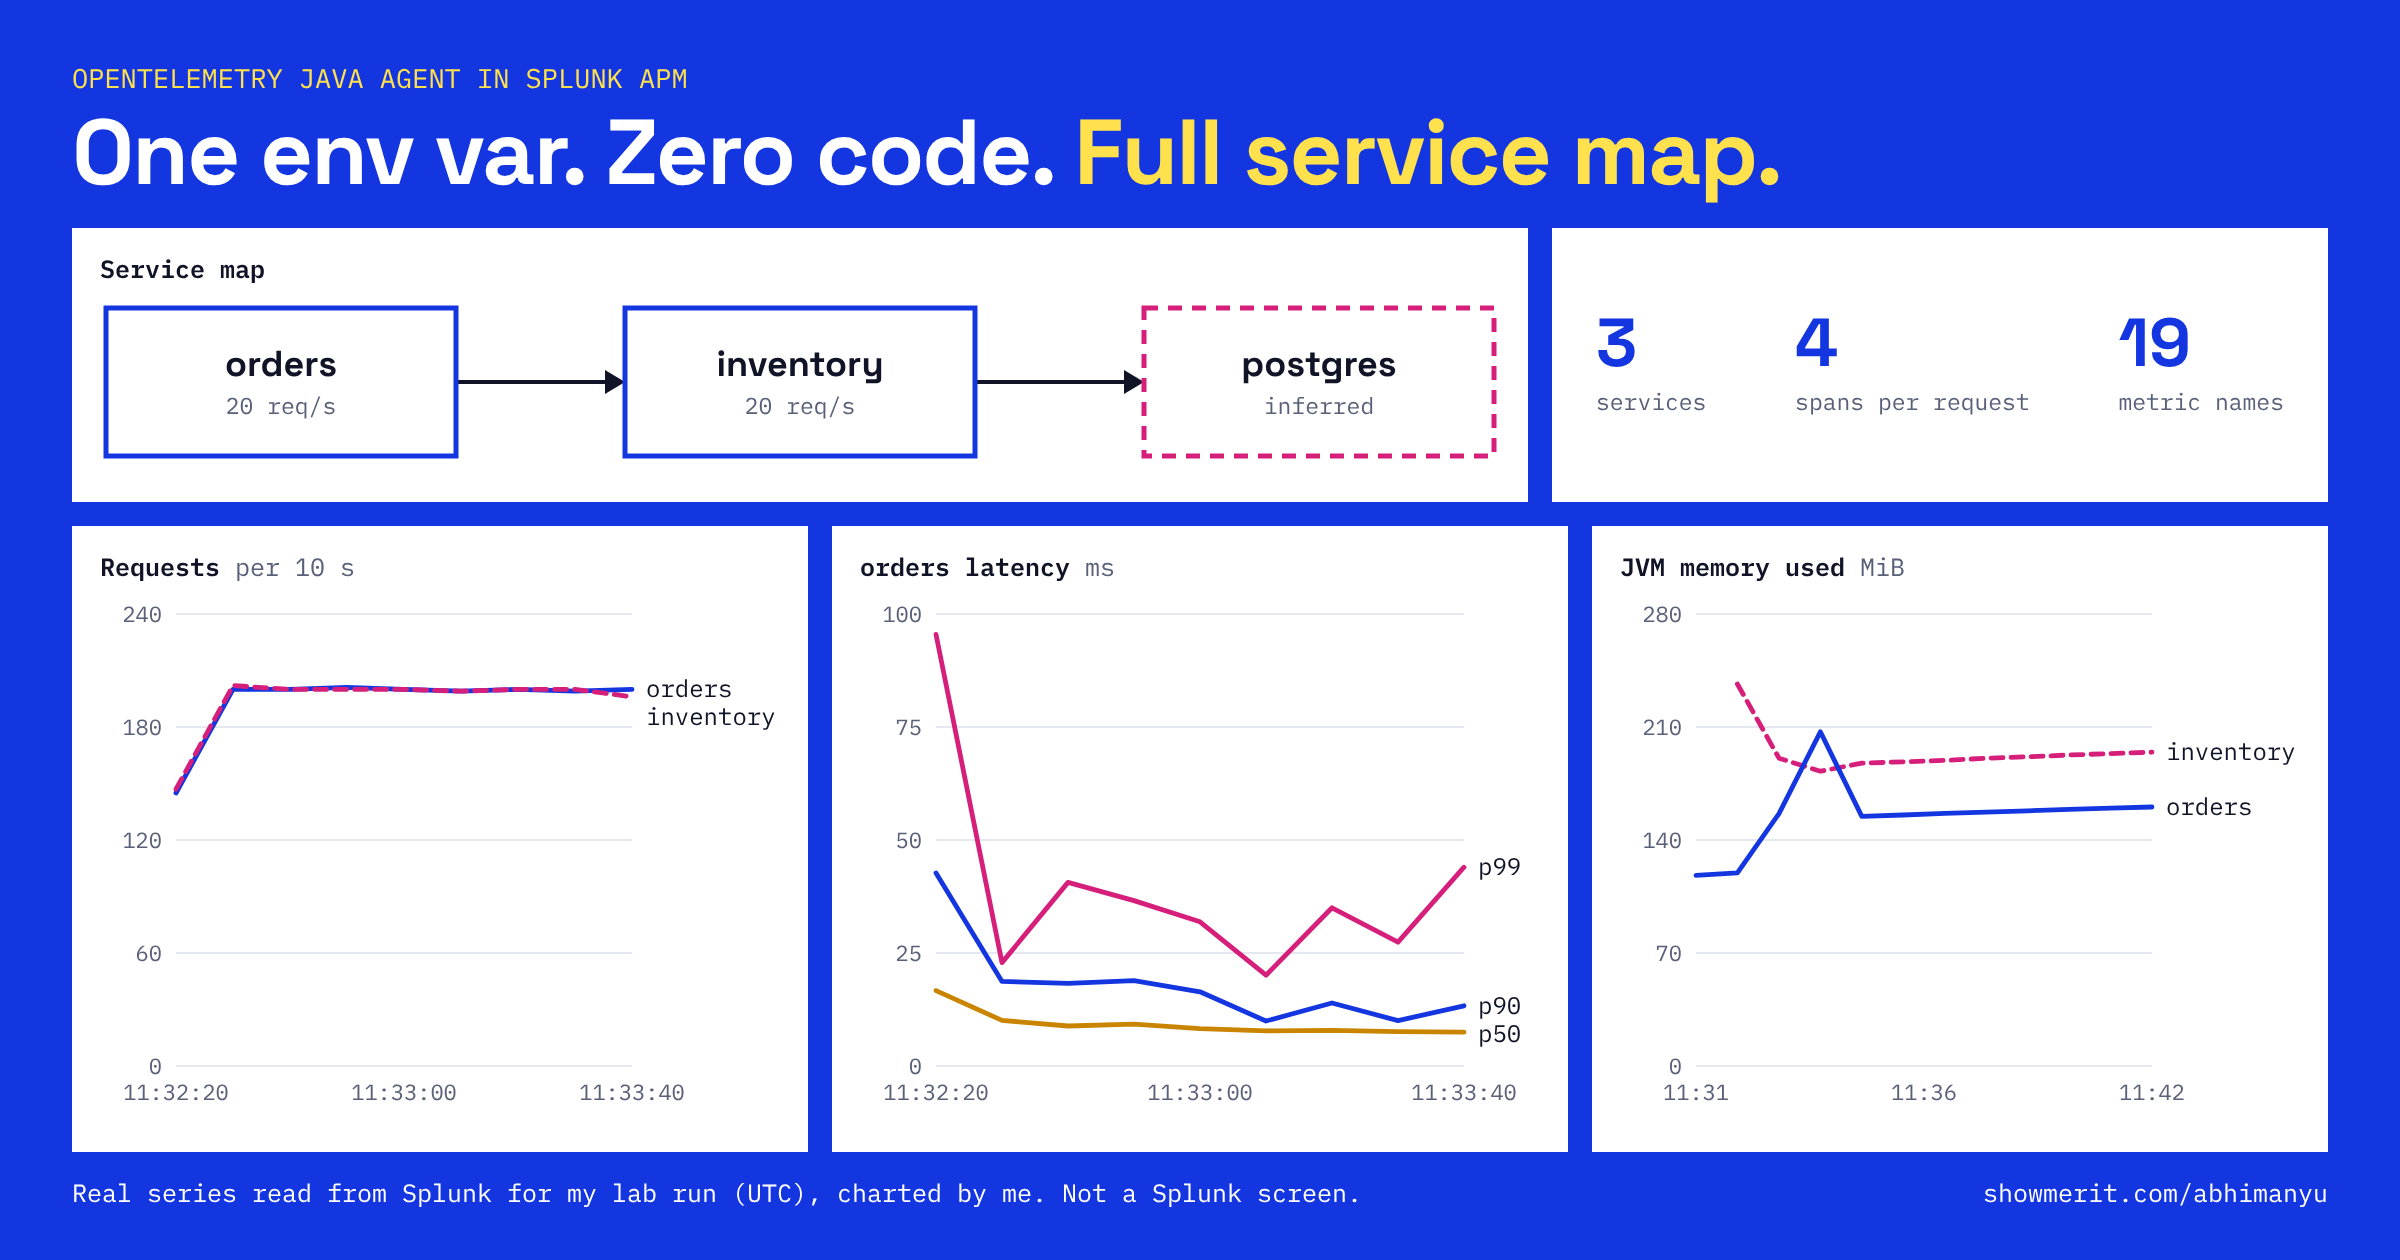
One environment variable put two Spring Boot services on a Splunk APM service map, with no code change and no new image. Splunk showed 3 services, 4 spans per request and 19 metric names, including a Postgres node that runs no agent.
That's the day-one result I want to hand a Java team. Turn the agent on, and they can see their dependencies, routes and database calls before anyone writes a span.
I work a lot with Java instrumentation inside Kubernetes clusters, so I built this with real services and kept the raw output. Here's what appeared, what to plan for, and how to build it yourself.
TL;DR
- What you get: a Splunk APM service map, request traces, and JVM and connection pool metrics from a Spring Boot service, with no code change.
- How: the JVM reads
JAVA_TOOL_OPTIONS, so one variable attaches and configures the agent.- The proof: the jar's hash stayed the same, Splunk found 3 services including Postgres, and one request showed 4 spans.
- Time: about 8 minutes for the cluster, then about 5 and 12 for the two scripts.
One variable, no new image
The JVM picks up JAVA_TOOL_OPTIONS when it starts, so you can attach the agent without touching the image, the entrypoint or the code:
for s in orders inventory; do
kubectl -n demo set env "deployment/$s" "JAVA_TOOL_OPTIONS=-javaagent:/lab/opentelemetry-javaagent.jar -Dotel.service.name=$s -Dotel.exporter.otlp.endpoint=http://\$(HOST_IP):4318 -Dotel.resource.attributes=deployment.environment=$LAB_NAME,deployment.environment.name=$LAB_NAME -Dotel.logs.exporter=none" >/dev/null
done
This is the upstream OpenTelemetry Java agent 2.33.1 with Splunk OTel Collector chart 0.163.1 and Spring Boot 3.5.6. That value attaches the agent, names the service, points it at the Collector on the same node, and sets the environment you filter by in APM. It also turns log export off for this lab. HOST_IP comes from the pod's own spec.
After the rollout, the jar's hash still matched:
orders jar: e9c6db24a1e342f6bae103fb67b936724fa187e3aa40aa7a04e5b61514780d01 /lab/app.jar
jar unchanged from the before run
The Splunk OTel Collector was already running before I measured anything, and Splunk was receiving the cluster's own data. So the agent is the only thing that changed:
cluster metric time series in Splunk: 2098
agent metric names in Splunk before the change: 0
What Splunk drew for you
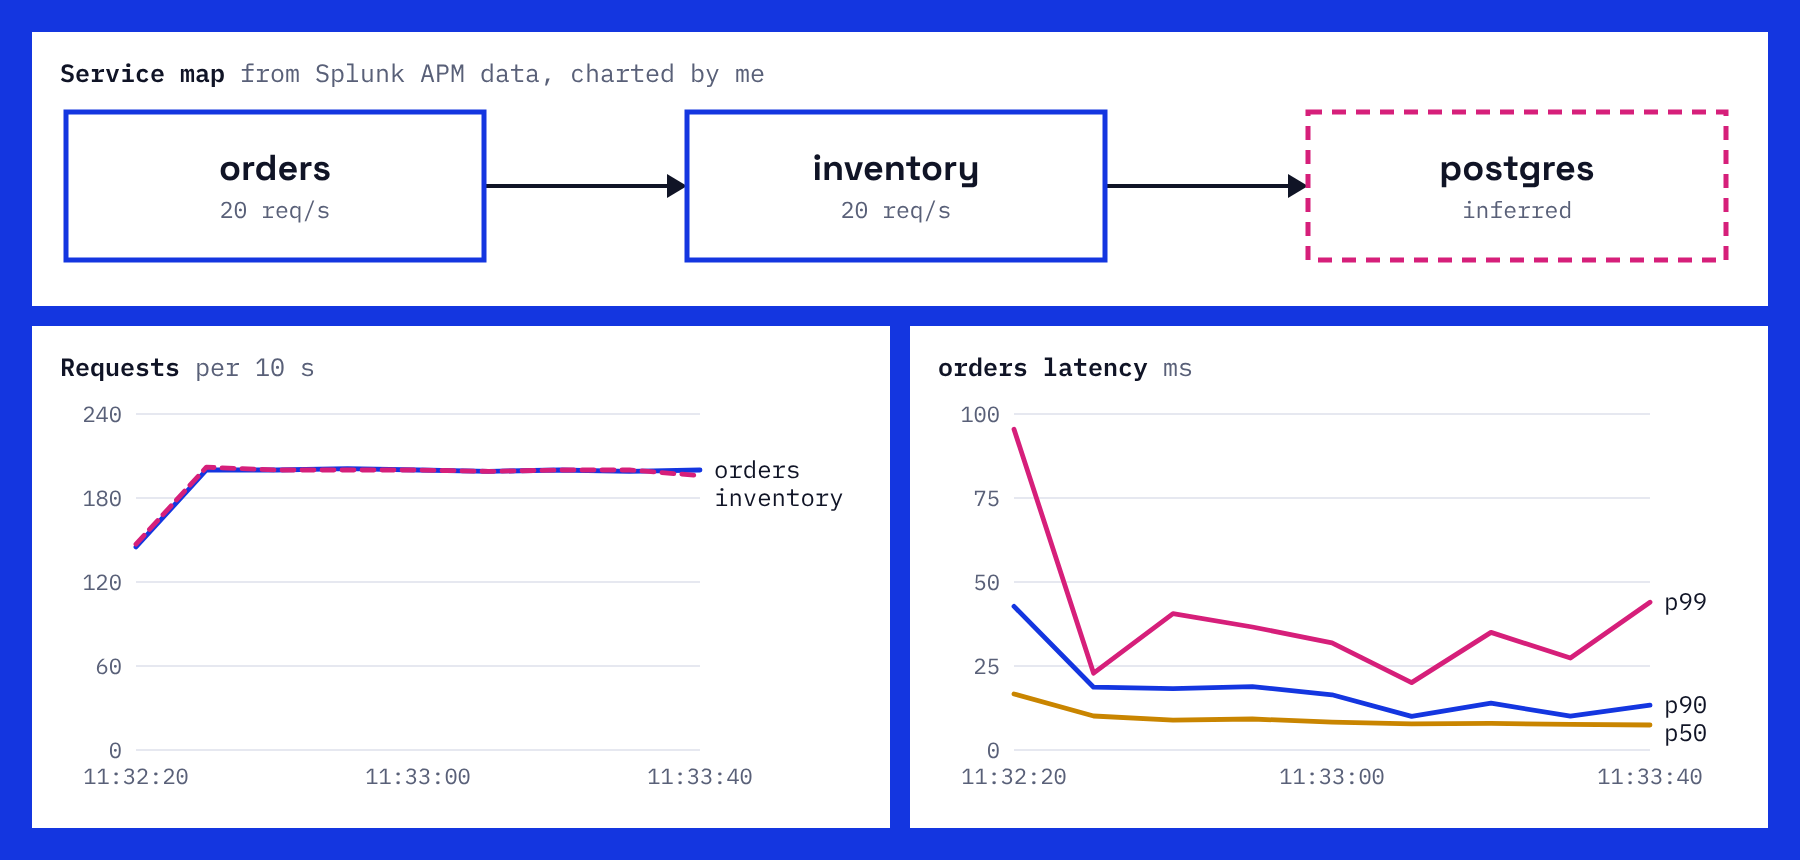
Splunk APM built the map by itself, and that includes Postgres, which runs no agent:
postgresql:postgres inferred=true
inventory inferred=false
orders inferred=false
inventory -> postgresql:postgres
orders -> inventory
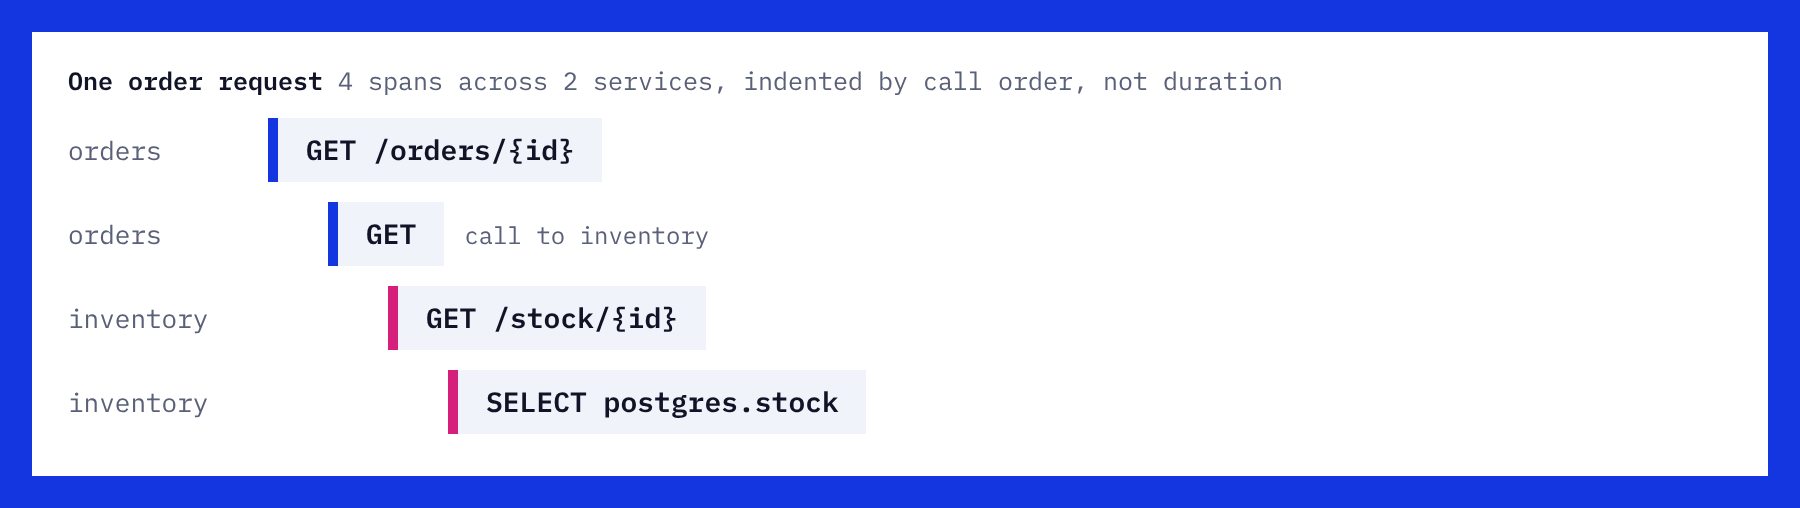
The load generator chose its own trace ID, so I could fetch one exact request from Splunk. It held 4 spans: GET /orders/{id} and an outgoing GET in orders, then GET /stock/{id} and SELECT postgres.stock in inventory. Those are route templates and a table name, written by no one on the app team.
The 19 metric names were 12 from the JVM, such as jvm.memory.used and jvm.gc.duration, and 7 from the connection pool, such as db.client.connections.usage. The map was there at my first check, 109 seconds after traffic started, and the trace was readable by 208 seconds.
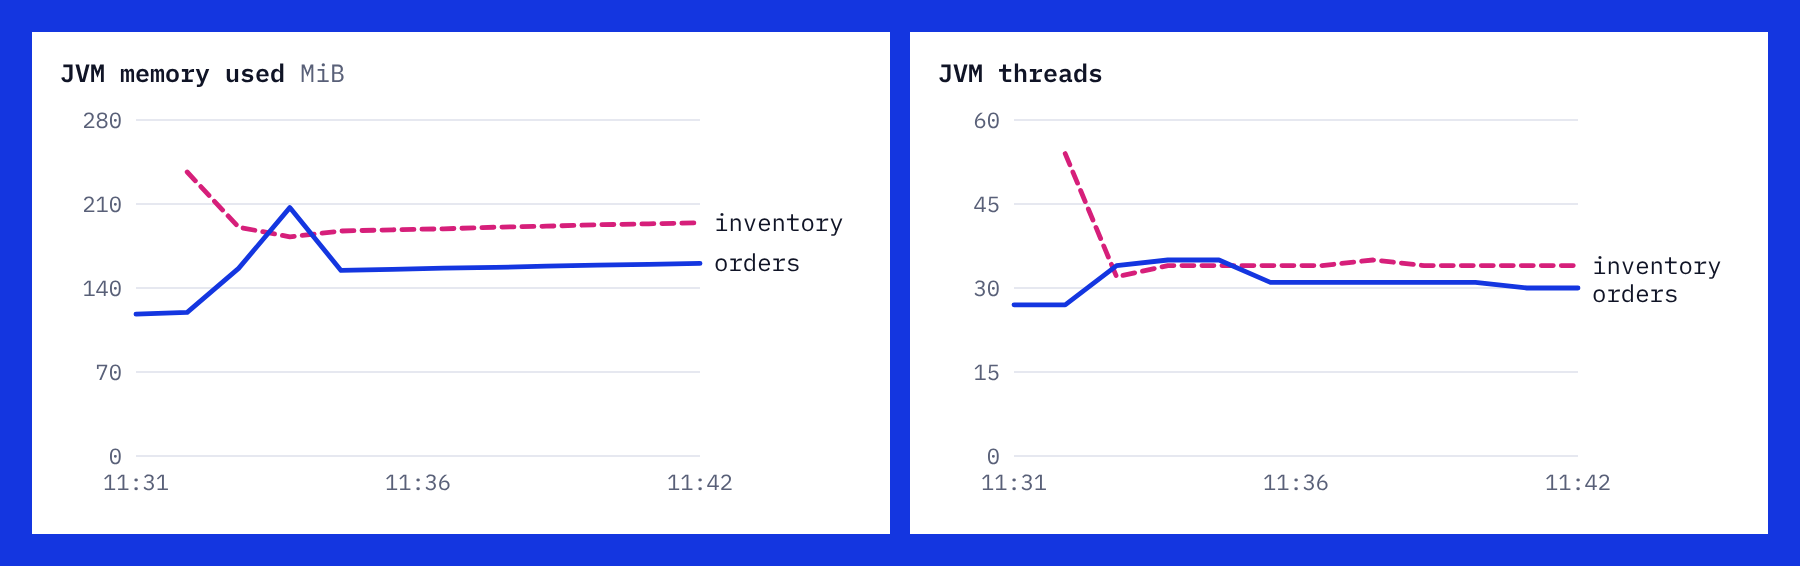
Requests stayed healthy throughout: the runs served 1179 and 1196 requests with 0 errors.
What to plan for before you roll it out
Same jar, image, nodes, Collector and load:
| Measure | Without agent | With agent |
|---|---|---|
| Order request p95 | 17.91 ms | 18.48 ms |
orders resident memory |
245812 kB | 349812 kB |
inventory resident memory |
240756 kB | 355916 kB |
orders startup, median |
11.107 s | 29.095 s |
inventory startup, median |
11.065 s | 28.382 s |
- Requests: the 0.57 ms p95 change comes from one 60-second window on each side, so read it as no large change.
- Memory: resident memory rose 101.6 to 112.5 MiB with the heap fixed at 256 MiB, so size limits from resident memory, not from
-Xmxalone. - Startup: the agent does its setup when the JVM starts, so give startup probes room. This node was deliberately tight: two JVMs restarting together on a burstable
t3.large, beside Postgres and the Collector, at 100m CPU requests. An 11-second baseline for a two-endpoint app shows that, so measure your own service instead of copying these figures.
The startup side keeps improving, too. Maintainers have a startup PR in review that reports a 5.19% cut on their benchmark, and the OpenTelemetry performance guide covers tuning.
Build it yourself in 3 steps
The app is small on purpose: orders calls inventory, and inventory reads Postgres.
Step 1: Create the cluster (about 8 minutes)
You need your Splunk realm, an ingest token and a read token.
git clone https://github.com/Abhimanyu9988/showmerit.git
cd showmerit/labs/opentelemetry-java-agent-in-splunk-apm-one-env-var-zero-code
export AWS_REGION=eu-central-1 LAB_NAME=otel-java TF_VAR_lab_name=otel-java
export SPLUNK_REALM=<realm> SPLUNK_ACCESS_TOKEN=<ingest-token> SPLUNK_API_TOKEN=<read-token>
terraform init && terraform apply
Step 2: Start with no agent (about 5 minutes)
./reproduce.sh
This installs the Collector, builds the jar once in the cluster, restarts each service three times, and sends one order request every 50 ms.
Step 3: Attach the agent and see it in Splunk (about 12 minutes)
./fix.sh
This sets the variable, repeats the measurements, and reads the results back from the Splunk API. In Splunk APM, filter by your LAB_NAME environment to see the map.
Use it for your own services
- Start with one team. Show them their service map and traces, then widen the rollout.
- Add custom spans where they earn it. The agent covers routes, calls and queries, and hand-written spans can follow for business steps.
Clean up
./cleanup.sh
terraform destroy
What I didn't test
- Logs. I turned log export off, because this lab sends to Observability Cloud only.
- HTTP duration metrics. No
http.*names appeared in my lookup during the 565 seconds it ran. The lookup may have missed them, so I haven't counted them either way. - Other shapes. This was one run at about 20 requests a second on burstable nodes, with the agent's default settings.
Every file in this lab
Everything above runs from these files. Open any of them to copy it, or clone the repo as shown:
README.mdcheck.shcleanup.shfix.shk8s/00-build.yamlk8s/10-app.yamlk8s/20-load.yamlmain.tfproviders.tfreproduce.shevidence/: the raw output of my run
Sources
- Metrics and attributes collected by the Splunk OTel Java agent
- OpenTelemetry Java agent performance guide
- Startup report in the OpenTelemetry Java repo
- Startup matching PR in the OpenTelemetry Java repo
- JAVA_TOOL_OPTIONS in the Java troubleshooting guide
Disclosure: I work at Splunk, part of Cisco. This is my personal writing; the post isn't sponsored or reviewed by my employer.
I built this in a disposable AWS lab. The lab code and raw output are public. Drafted with AI assistance and reviewed by me.