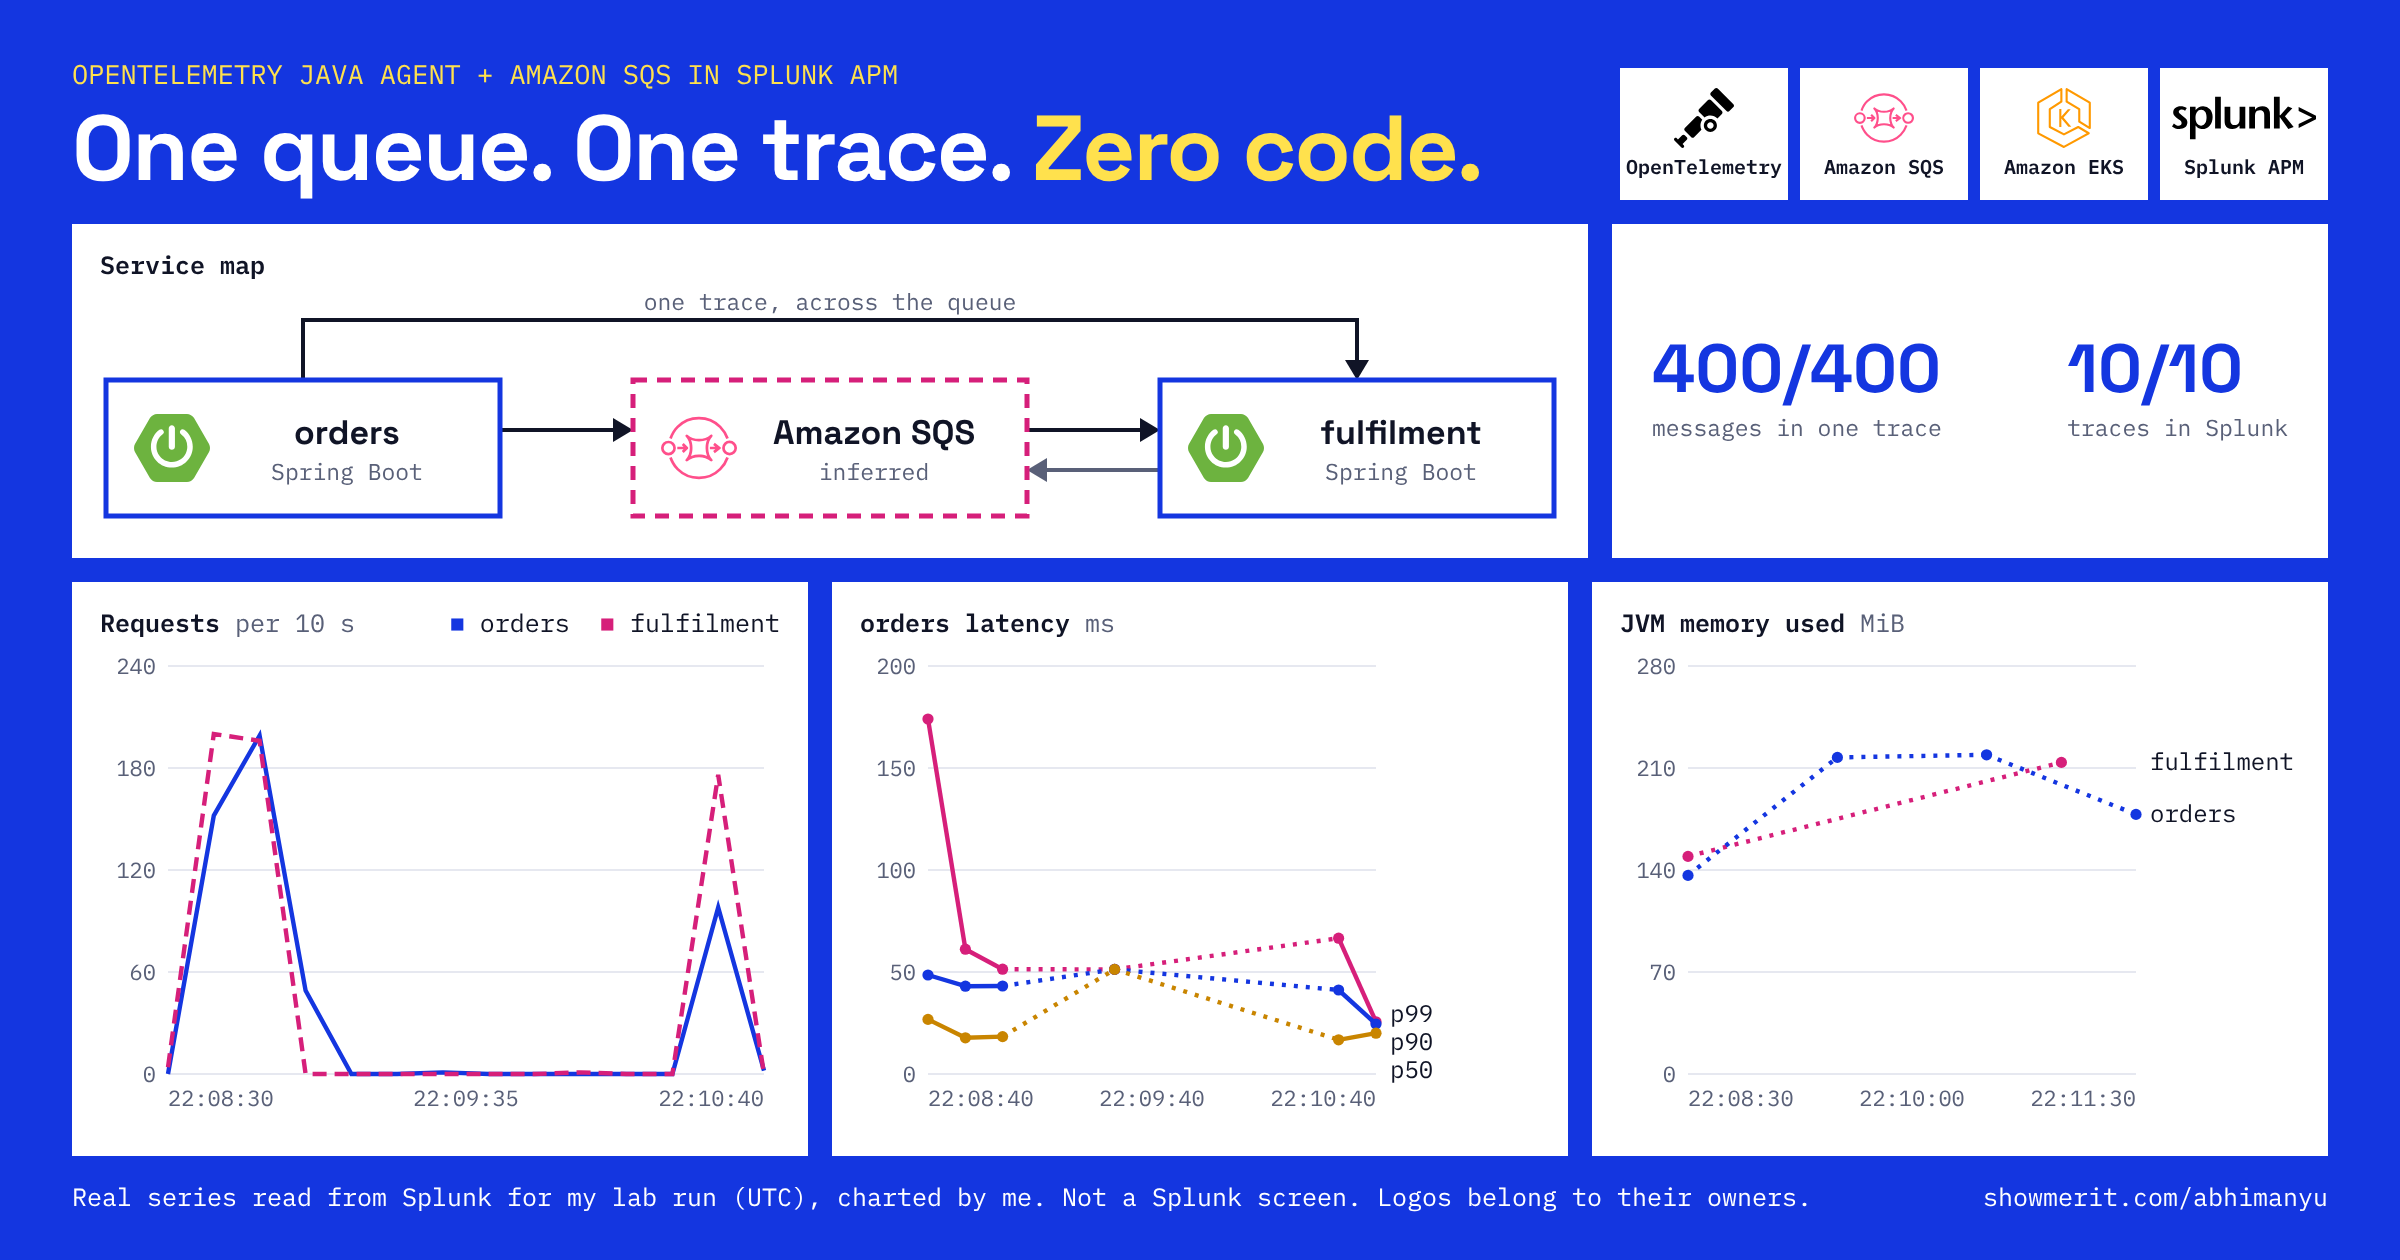
You want to follow one order from the HTTP request, into an SQS queue and out of it in another service, as a single trace. On Spring Boot, the OpenTelemetry Java agent gave me that from one environment variable: 400 of 400 messages had their producer and consumer spans in one trace, on a real queue on EKS, and all 10 traces I sampled in Splunk APM held both services.
No tracing code, no SQS setting, and the same jar as before. The pods needed the agent jar, which I mounted from the node, the variable that loads it, and a Splunk OTel Collector in the cluster to receive the spans.
I built this in a throwaway AWS account and counted it message by message. Below: how the trace crosses the queue, the one setting that changes its shape, and every step.
TL;DR
- What you get: one trace from the HTTP request through SQS to your
@SqsListenermethod, and both services on a Splunk APM service map.- How: the agent puts the trace in the message's
AWSTraceHeadersystem attribute.- The proof: 400 of 400 messages in one trace, 0 misses. All 10 sampled traces in Splunk held both services.
- Time and cost: about 20 minutes from
terraform applythroughterraform destroyin my run, with twot3.largenodes, the EKS control plane and one SQS queue running throughout. The README's one hour is a safe budget.
Why the queue is the part worth proving
A queue splits a request in two. One service sends, another picks the message up later, and nothing connects them over HTTP. A maintainer says the two should share a trace by default, and I wanted a count from a real queue to go with that.
The lab has two services from one jar, with Spring Boot 3.5.6 and Spring Cloud AWS 3.4.0. This is all the messaging code, and none of it knows about tracing:
@PostMapping("/orders/{id}")
public Map<String, Object> order(@PathVariable("id") long id) {
String messageId = sqs.send(queue, "order-" + id).messageId().toString();
return Map.of("order", id, "messageId", messageId);
}
@SqsListener("${queue.name}")
public void handle(String body) {
log.info("fulfilled {}", body);
}
With no agent attached, every order arrives, and the message carries no trace:
no_agent run: sent 400, fulfilled 400, producer spans 0, consumer spans 0
message 47d4f7f7-c828-44d6-8bc2-ac32ee16cfdd AWSTraceHeader: none
no_agent run, messages carrying the header: 0
The second line is one waiting message, read directly from the queue while fulfilment was paused.
The trace rides on the message itself
SQS has a message system attribute built for trace headers, called AWSTraceHeader. The Java instrumentation uses it by default, and AWS notes that the attribute doesn't count towards message size.
I ran the same read with agent 2.33.1 attached:
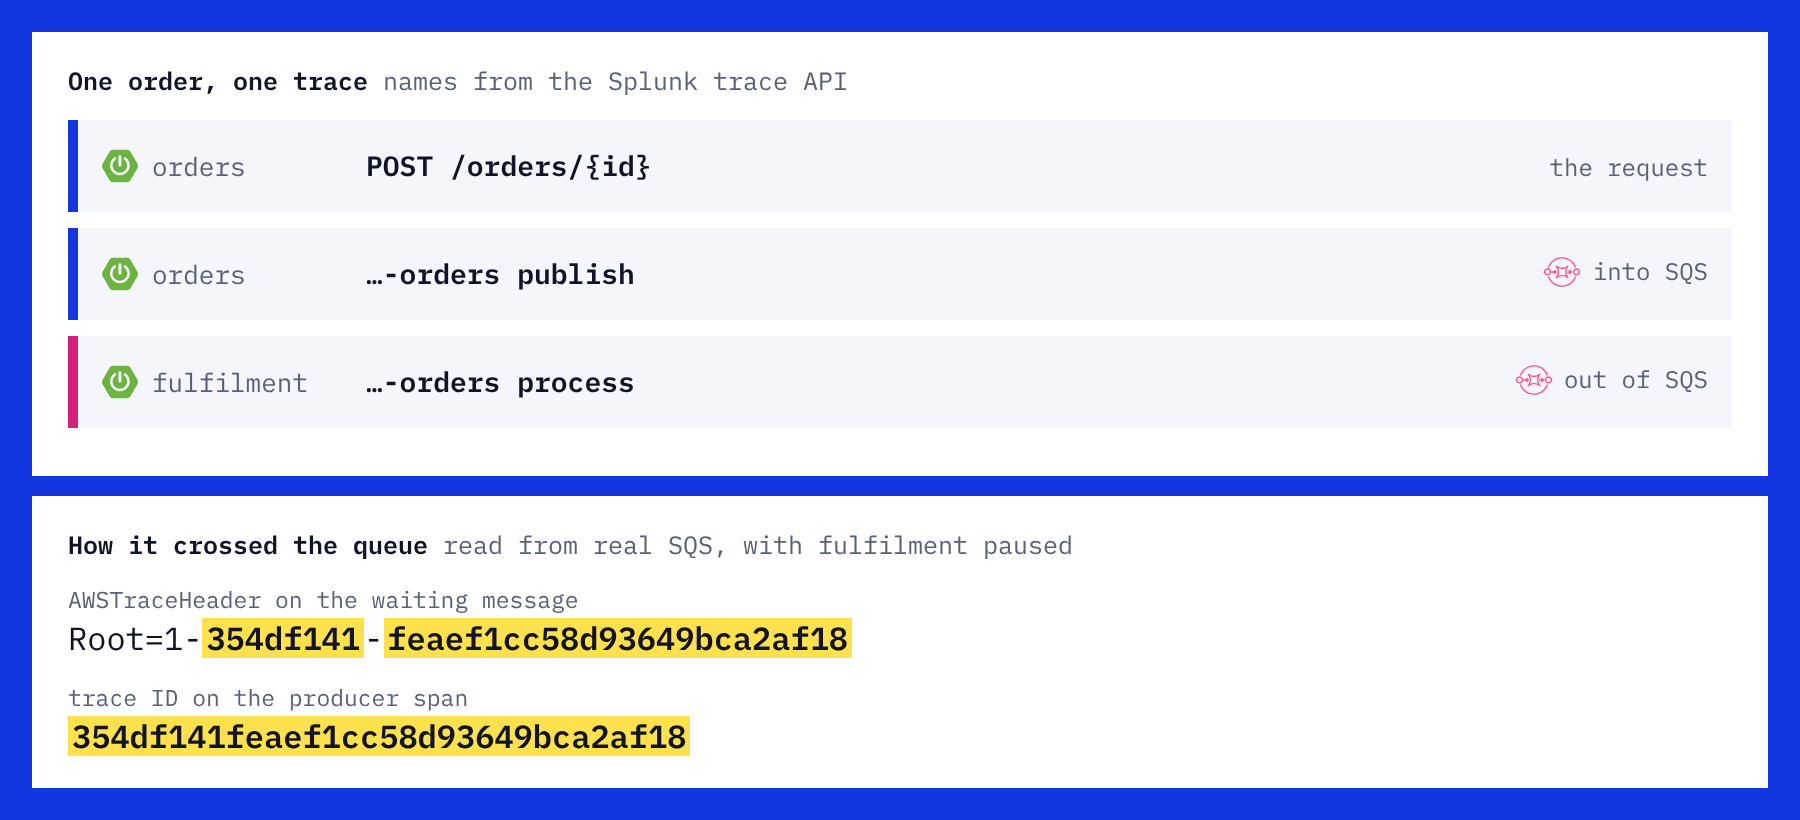
message d5a18fb0-fa79-47c5-8f1c-dfc5dcb98c65 AWSTraceHeader: Root=1-354df141-feaef1cc58d93649bca2af18;Parent=7475d1a4838a35dd;Sampled=1
trace ID in the header: 354df141feaef1cc58d93649bca2af18, on the producer span: 354df141feaef1cc58d93649bca2af18
trace header root matches the producer span: 1
The header uses the AWS X-Ray format, and it holds the same trace ID as the producer span once you remove the dashes.
Build it yourself in 3 steps
My run's logged phases: terraform apply 481 s, reproduce.sh 213 s, fix.sh 277 s, cleanup.sh 9 s, terraform destroy 181 s.
Step 1: Create the cluster and the queue (about 8 minutes)
git clone https://github.com/Abhimanyu9988/showmerit.git
cd showmerit/labs/follow-sqs-messages-through-splunk-apm-with-the-otel-java
export AWS_REGION=eu-central-1 LAB_NAME=sqs-trace-lab TF_VAR_lab_name=sqs-trace-lab
export SPLUNK_REALM=<realm> SPLUNK_ACCESS_TOKEN=<ingest-token> SPLUNK_API_TOKEN=<read-token>
terraform init && terraform apply -auto-approve
The pods hold no AWS keys. EKS Pod Identity gives the sqs-lab service account a role that can only use this queue:
resource "aws_eks_pod_identity_association" "sqs" {
  cluster_name    = aws_eks_cluster.main.name
  namespace       = "demo"
  service_account = "sqs-lab"
  role_arn        = aws_iam_role.sqs.arn
  depends_on      = [aws_eks_addon.pod_identity]
}
Step 2: Run both services with no agent (about 4 minutes)
Run ./reproduce.sh. It installs the Splunk OTel Collector with chart 0.163.1, builds the jar once in the cluster, and sends 400 orders.
Step 3: Attach the agent and count (about 5 minutes)
Run ./fix.sh. The whole change is one variable on each Deployment. This is what you'd ship, with HOST_IP set from status.hostIP so the agent can reach the Collector on its node:
JAVA_TOOL_OPTIONS=-javaagent:/path/to/opentelemetry-javaagent.jar -Dotel.service.name=orders -Dotel.exporter.otlp.endpoint=http://$(HOST_IP):4318
Set deployment.environment in otel.resource.attributes too, as the lab does, so your services appear under an environment in Splunk APM. The lab mounts the jar from the node to keep the image unchanged. An init container or the OpenTelemetry Operator are common ways to deliver it in production, though I didn't test those here.
The script also adds console and logging-otlp exporters, for counting only. It then joins each message's publish span and process span on the SQS message ID.
The proof: 400 messages, 400 joined, 0 misses
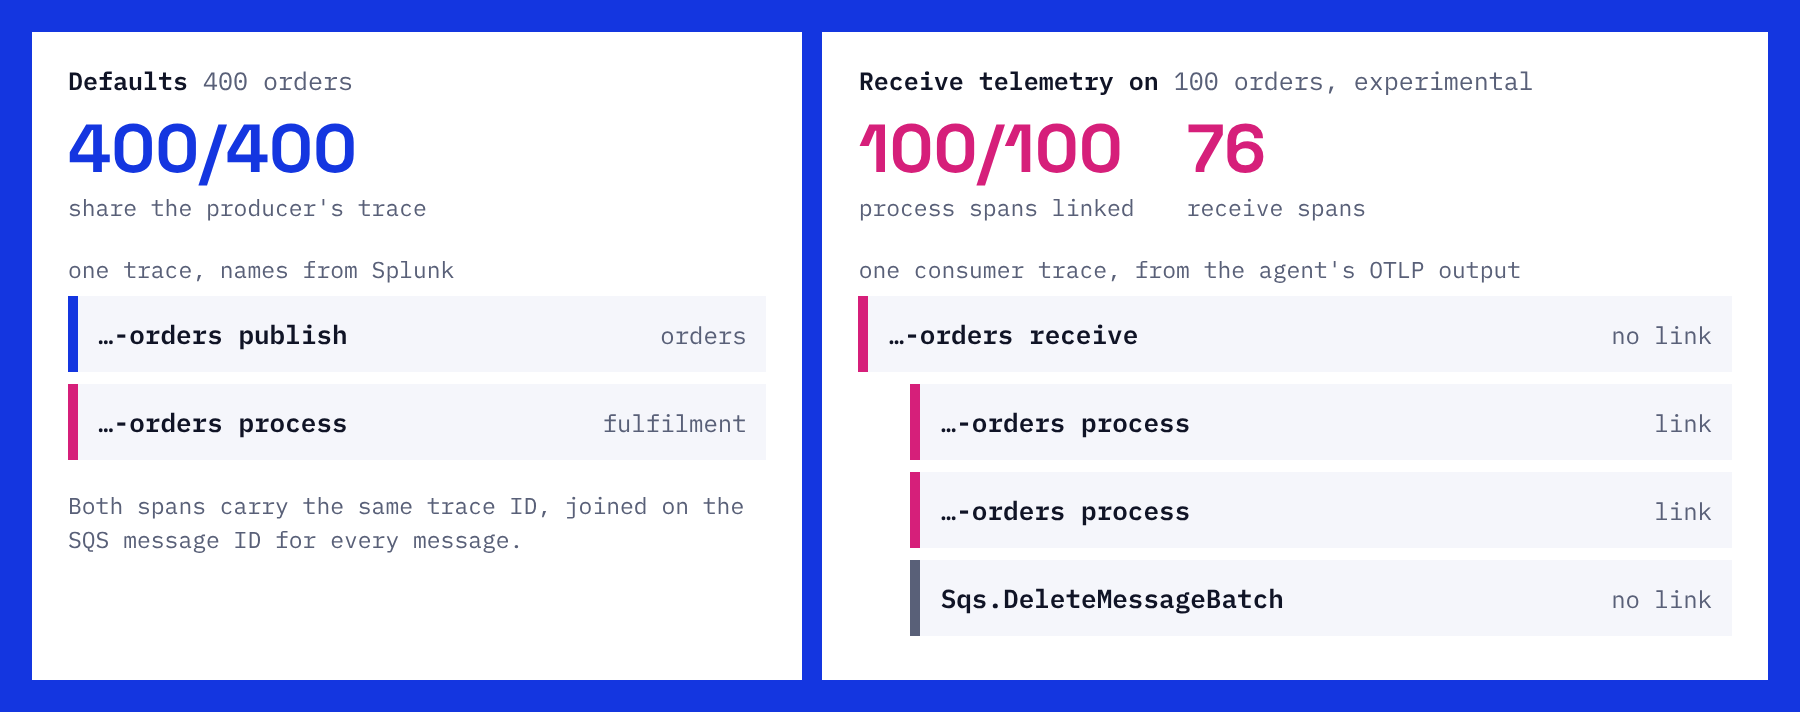
default run: sent 400, fulfilled 400, producer spans 400, consumer spans 400, joined on message ID 400, sharing one trace 400, distinct traces 400
default run, misses: no process span 0, no producer span 0, different trace 0. Most process spans for one message: 1
one trace percent, default run: 100.0
default run, consumer spans linked to the producer: 0
default_receive_span links to the producer: 0
default run, receive spans: 0
-- three of the joined rows: message ID, producer trace, consumer trace
  0127de22-485b-428a-acc7-034f2e4dcf5e c5cbf7e49265aebe6aacdeb6bdad9d02 c5cbf7e49265aebe6aacdeb6bdad9d02
  012bcc56-c649-433e-812b-63b9f712ed34 f90a7d13ce7bb5e8e60c0262a34f49ad f90a7d13ce7bb5e8e60c0262a34f49ad
  01771e24-4d49-4a6a-abdb-12586654acef 368cd3268d19dbf632c4a0b16e5657b2 368cd3268d19dbf632c4a0b16e5657b2
sampled traces with both services in one trace in Splunk: 10 of 10
The two trace IDs on each row match. Each order got its own trace and exactly one process span. Neither pod had an instrumentation setting for SQS, and the jar's hash matched the run with no agent.
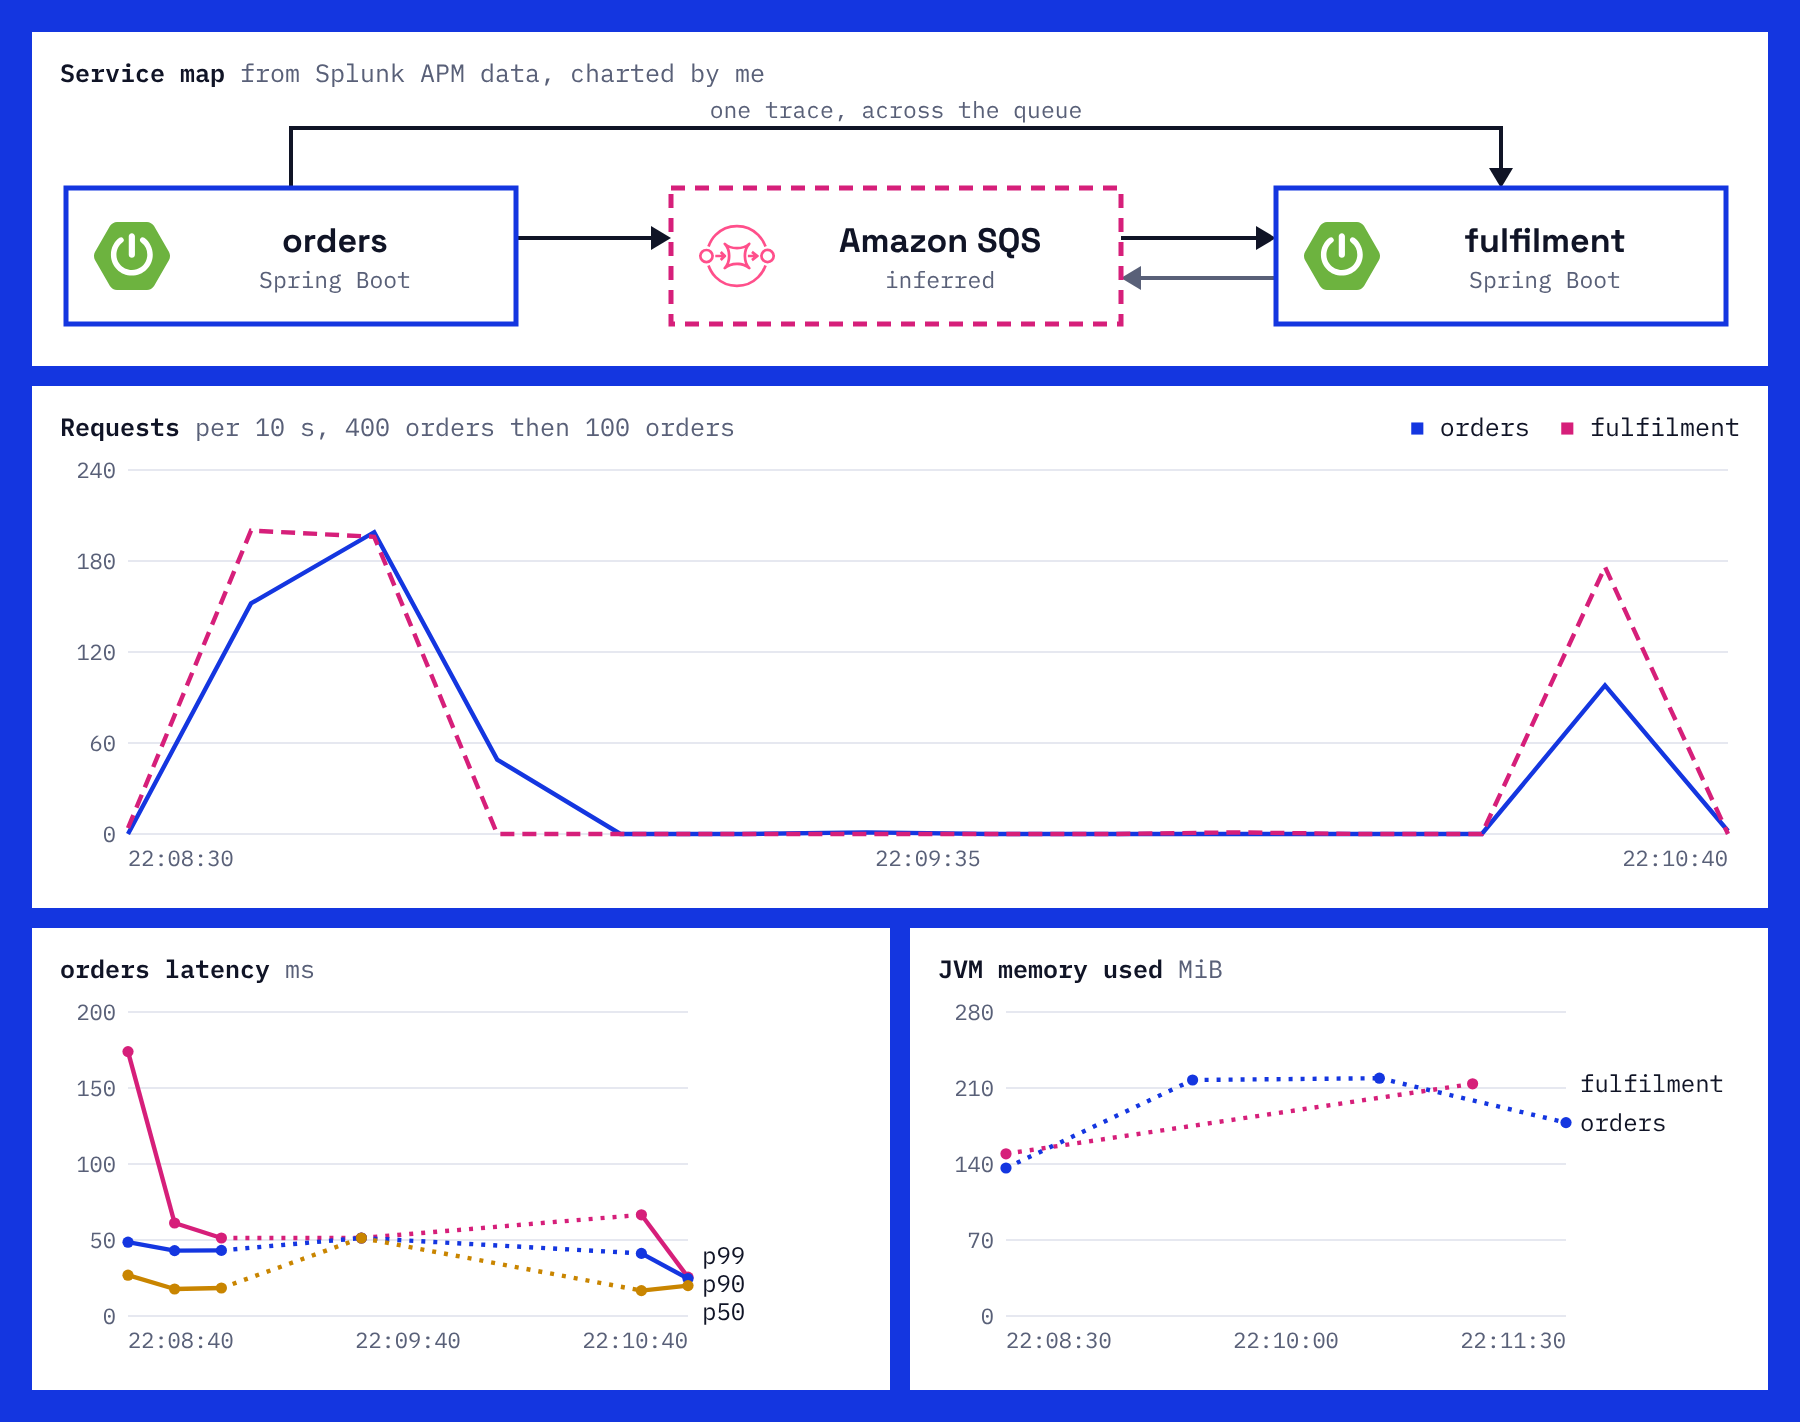
Splunk APM agreed. Both services appeared on the map, with sqs as an inferred node and a path from orders to fulfilment.
One experimental setting gives each consumer a linked trace
The defaults give you one trace per message. The agent also offers a second shape, where each consumer gets a trace of its own, linked back to the producer. I set otel.instrumentation.common.messaging.experimental.receive-telemetry.enabled=true on fulfilment and sent 100 more orders:
receive_telemetry run: sent 100, fulfilled 100, joined on message ID 100, sharing one trace 0, in their own trace 100. Most process spans for one message: 1
receive_telemetry run, consumer spans linked to the producer: 100
receive_telemetry_receive_span links to the producer: 0
receive_telemetry run, process spans whose parent is a receive span: 100
receive_telemetry run, receive spans: 76
| Run | Messages | In the producer's trace | Linked to the producer | Receive spans |
|---|---|---|---|---|
| Defaults | 400 | 400 | 0 | 0 |
| Receive telemetry | 100 | 0 | 100 | 76 |
Receive spans going from 0 to 76 shows the agent applied the setting. The link sits on the process span, not the receive span. One consumer trace from the agent's output shows why there are fewer receive spans than messages, with one receive span holding two messages:
  follow-sqs-messages-thro-738351-orders receive kind=5 span=3c4aa35a087891e3 parent=none links=
    follow-sqs-messages-thro-738351-orders process kind=5 span=88f2e0f96c7c481c parent=3c4aa35a087891e3 links=3d4b7a86685e7351af999a6440905f9c
    follow-sqs-messages-thro-738351-orders process kind=5 span=2e2a9857c6bf3525 parent=3c4aa35a087891e3 links=344012b64ebe2e596b7c31a64d93b17c
    Sqs.DeleteMessageBatch kind=3 span=f956636b787d5a63 parent=3c4aa35a087891e3 links=
Keep the default to see a whole order end to end. Try this setting when you want each consumer's work in a trace of its own, and recheck it when you upgrade, because it's experimental.
Use it on your own queues
- Start with one pair of services. If they use
SqsTemplateand single-message@SqsListenermethods, try the variable before asking anyone for code. - Know the other carrier.
otel.instrumentation.aws-sdk.experimental-use-propagator-for-messagingdefaults tofalse. Turning it on moves context into message attributes with your configured propagator. The maintainer says it changes how context travels, not whether spans share a trace, and suggests it for a stand-in that doesn't keepAWSTraceHeader.
Clean up (about 3 minutes, and the cluster costs money until it's done)
./cleanup.sh
terraform destroy -auto-approve
What I didn't test
- Batch listeners. My listener takes one message at a time, polling up to 10. The maintainer discussion notes exceptions for batch receives, so measure your own if a method takes a
List. - Anything beyond this setup. I used agent 2.33.1 and standard SQS sends of one message at a time. I didn't try FIFO queues,
SendMessageBatchor the propagator setting. - Overhead. Both services ran with extra span logging for counting, on one
t3.large, so this lab says nothing about latency. Each setting ran once.
Every file in this lab
Everything above runs from these files. Open any of them to copy it, or clone the repo as shown:
README.mdcheck.shcleanup.shfix.shk8s/00-build.yamlk8s/10-app.yamlk8s/15-standin-sqs.yamlk8s/20-load.yamllib.shmain.tfproviders.tfreproduce.shsplunk.shevidence/: the raw output of my run
Sources
- Springboot sqs instrumentation, the maintainer discussion
- Message metadata for Amazon SQS
- Settings for the AWS SDK instrumentation
- AWS SDK instrumentation metadata at v2.33.1
- Spring Cloud AWS reference
Disclosure: I work at Splunk, part of Cisco. This is my personal writing; the post isn't sponsored or reviewed by my employer.
I built this in a disposable AWS lab. The lab code and raw output are public. Drafted with AI assistance and reviewed by me.